Economic and Financial
Performance
In 2011, CTEEP's net operating
revenue was 28.6% higher,
totaling BRL2.9 billion. EBITDA
grew by 23.8%.
Financial Performance
GRI EC1
The growth strategy adopted by CTEEP, based on adding value to the business through best corporate governance practices and sustainable financial results and on significant expansion of the base of assets and operational excellence, resulted in notable results in 2011.
| $ Thousands(*) | ||||
|---|---|---|---|---|
| Components | 2008 | 2009 | 2010 | 2011 |
| Direct economic value created | - | 1,815 | 1,735 | 2,026 |
| a) Net sales revenue | - | 1,815 | 1,735 | 2,026 |
| Economic value distributed | - | 1,989 | 1,855 | 2,098 |
| b) Operational expenses | - | 450 | 400 | 504 |
| c) Employee salaries and benefits | - | 157 | 160 | 194 |
| d) Payment for capital providers | - | 783 | 772 | 789 |
| e) Payment to the government | - | 600 | 523 | 611 |
| f) Investments in the community | - | 0 | 0 | 0 |
| Accumulated economic value | - | 3,804 | 3,590 | 4,124 |
Accounting Statements
CTEEP consolidated financial statements were drafted pursuant to the accounting standards used in Brazil, which include the provisions contained in the Law or Publically Traded Corporations, standards, interpretations and guidelines issued by the CPC (Comitê de Pronunciamentos Contábeis) and approved by the CVM (Comissão de Valores Mobiliários). Financial statements are in compliance with IFRS (International Financial Reporting Standards) standards issued by the IASB (International Accounting Standards Board).
Independent Auditing
CTEEP complies with the principles that preserve the independence the external auditor, who should not audit his own work, or exercise a managerial role ore even advocate on behalf of his client. The policies of the Company and its controlled companies prohibit the hiring of independent auditors to provide services if their hiring may create a conflict of interest or loss of objectivity.
Individual and consolidated financial statements regarding 2011 were audited by Ernst & Young Auditores Independentes S.S. ("Ernst & Young Terco").
Allowed Annual Revenue
Resolution No. 1,171, published on June 28, 2011, established allowed annual revenues for CTEEP and its controlled companies, based on the availability of transmission facilities that are part of the Basic Network and of Other Transmission Facilities for the 12 month cycle covering the period from July 1, 2011 to June 30, 2012.
CTEEP's RAP, which was BRL1,760.8 million on July 1, 2010, went to BRL2,008.3 million on July 1, 2011, increasing by BRL247.5 million or 14.1%.
The RAP for the Company along with its controlled companies, which was BRL1,861.2 million on July 1, 2010, went to BRL2,120.6 million on July 1, 2011, rising by BRL259.4 million or 13.9%.
Variable Portion
The variation in the supply and demand for electricity does not interfere in the monthly income at CTEEP, whose Allowed Annual Revenue (RAP) is established by ANEEL and is not dependent upon the amount of energy transported.
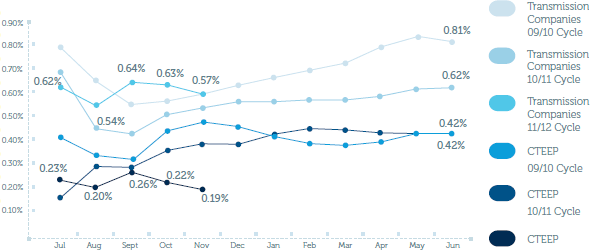
The component that interferes with revenue is the Variable Portion (VP), which is discounted from transmission company RAP based on unavailability or restriction of facilities that are part of the Basic Network. In 2011, the discount regarding the Variable Portion was 0.27% of revenue, well below the industry average, which is around 0.57%.
The Additional RAP corresponds to the amount to be added to transmission company revenue as an incentive to improve availability of transmission facilities. In 2011, the Company received an additional RAP in the amount of BRL3,467,868.02 in reference to the 2010/2011 Cycle, established by the ANEEL because of the high availability of its assets (99.98%). This additional payment caused the Variable Portion to drop from 0.27% to 0.05% of the RAP.
Variable Portion
In 2010 and 2011, CTEEP received 29.76% of the total industry VP premium – around BRL3.4 MM..
Revenue
Construction Revenues |
Maintenance and Operations Revenues (BRL millions) |
 |
 |
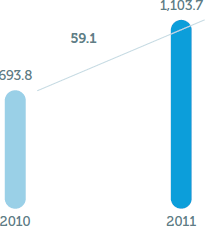
Construction Revenue totaled BRL1,103.7 million in 2011, rising 59.1% compared to 2010, when it was at BRL693.8 million. This increase is the result of the advancement of work at Serra do Japi (an additional BRL153.7 in 2011) and at IEMadeira (an additional BRL594.9 in 2011), as well as of CTEEP reinforcement and expansion projects. This increase was off-set by the conclusion of work at IENNE, IESul and Pinheiros during fiscal year 2010.
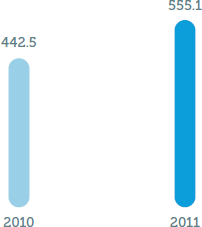
Maintenance and Operation Revenues totaled BRL555.1 million in 2011, compared to BRL442.5 million in 2010, which accounts for growth of 25.4% for the fiscal year and mostly reflects the monetary restatement of the RAP for the 2011/2012 cycle.
Financial Revenues coming from concession agreements totaled BRL1,589.9 million in 2011, rising by 13.7% compared with BRL1,398.2 million in 2010. This growth reflects payment of the balance of construction accounts receivable, which had a positive variation of 21%.
Moreover, in July 2011, the Company and its controlled companies acknowledged the positive adjustments coming from annual tariff repositioning, which affected its cash flows in the amount of BRL246.9 million (in relation to BRL86.4 million in 2010) as an adjustment to the annual financial revenue.
Operational Revenue Deductions reached BRL367.9 million in 2011, compared to BRL295.3 million in 2010, accounting for taxes and charges that reflect the growing operational revenue.
As a result of the aforementioned factors, the Net Operating Revenue rose by 28.6% in 2011, reaching BRL2,009.8 million.
Operational Costs and Expenses
Construction and operation/maintenance costs were 39.6% higher, reaching BRL1,323.4 million in 2011 in relation to BRL948.3 million in 2010. This increase was the result of an additional BRL366.5 million for expenditures on materials and services that were mostly applied to the Serra do Japi and IEMadeira projects.
General and administrative expenses fell by 7.9% in 2011, totaling BRL127.0 million compared to BRL137.9 million in 2010.
Among the transactions that took place during the fiscal year, the following are noteworthy: (i) reversal of the provision for contingencies, in the amount of BRL27.6 million; (ii) creation of a provision for inventory losses totaling BRL17.9 million; (iii) increased expenditures in contracting services in the amount of BRL6.0 million; and (iv) additional personnel expenses in the amount of BRL3.2 million, which was basically due to the period's collective bargaining agreement.
EBITDA and EBITDA |
Net Earnings |
 |
 |
EBITDA and EBITDA Margin
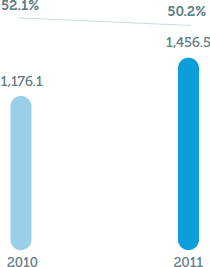
In 2011, CTEEP registered an EBITDA (Earnings Before Interest, Taxes, Depreciations and Amortizations) of BRL1,456.5 million (growth of 23.8% in relation to BRL1,176.1 in 2010) and an EBITDA margin of 50.2% (dropping by 1.9 percentage points in relation to 52.1% in 2010).
Financial Result
The financial result reached expenditures of BRL200.5 million in 2011, which accounted for a 91.5% increase compared to the BRL104.7 million in 2010, due to greater financial leveraging.
In 2011, CTEEP raised BRL500.0 million in Promissory Notes and BRL250.0 million in international Bank Credit Notes and Commercial Paper, generating an additional financial expense of approximately BRL47 million.
The Serra do Japi and IEMadeira controlled companies had increased short-term funding and the Pinheiros, IESul and Serra do Japi controlled companies had new long-term funding from the Brazilian Development Bank (BNDES), creating an additional financial expense of approximately BRL24.0 million. The increase in the rate of Interbank Deposit Certificates from 2010 to 2011 raised the total cost of debt by approximately 1.68% a.a., mostly as a result of greater short-term funding, especially for the Serra do Japi and IEMadeira controlled companies, which are currently constructing power lines.
Expenditures on income tax and social contributions were 32.5% higher, totaling BRL303.8 million in 2011 versus BRL229.4 in 2010. The effective rate of income tax and social contribution was 24.9% in 2011 – in 2010 it was at 22%. The main permanent differences justifying the variation between the effective rate and the nominal rate are the expense of interest on shareholder capital, the result of equity accounting, and reversal of the provision to maintain the integrity of shareholder equity (because of the fiscal benefit from the premium paid by ISA Capital in the process of acquiring shareholder control over CTEEP).
Net Earnings
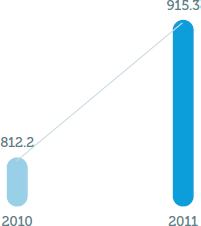
In 2011, CTEEP's net earnings totaled BRL915.3 million, an amount that is 12.7% higher than the BRL812.2 million earned in 2010. With this result, the net margin reached 31.6% in 2011 compared to 36.0% the previous year. The 4.4% drop in net margin is explained by higher costs and expenditures throughout 2011.
Indebtedness
Consolidated gross debt on December 31, 2011, totaled BRL2,771.4 million. Of total consolidated gross debt, BRL1,109.5 million (40%) was connected to loan contracts with the BNDES. At the end of 2011, net debt was at BRL2,564.1 million. The rate of indebtedness (ratio between net debt and shareholder equity) reached 56.5% at the end of 2011.
Distribution of Added Value
Distribution of Added Value
GRI EC1
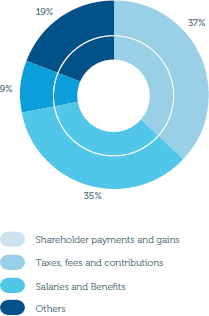
In 2011, CTEEP's Added Value totaled BRL2,198.6 million, an amount that is 22.7% higher than it was in 2010. Of this total, BRL789.0 million concern payments of shareholder gains (dividends and shareholder equity), BRL734.4 regard federal, state and municipal taxes, fees and contributions; and BRL199.7 million were used to pay employee salaries and benefits.
Capital Market
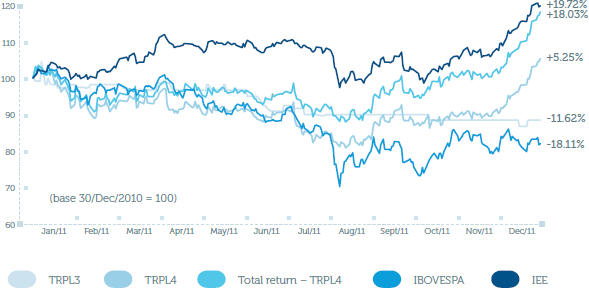
Ordinary and preferential shares in CTEEP (BM&FBOVESPA: TRPL3 and TRPL4) ended 2011 quoted at BRL54.00 and BRL57.99, respectively, which represents variation of -11.62% and +5.25%, also respectively, in relation to 2010. When the share price is added to the gains paid to shareholders, the return regarding preferential shares (which have greater liquidity) was 18.03%. During fiscal year 2011, Ibovespa lost 18.11% of its value and the Índice de Energia Elétrica (IEE) (Electric utilities Index) rose in value by 19.72%.
Throughout the year, preferential shares in CTEEP showed an average daily trading volume on the BM&FBovespa of BRL7.2 million. The total volume traded in 2011 was BRL1,796.0 million.
Financial volume traded in 2011 (BRL millions)

Quantity of trades in 2011 (unit)

Circulation of ADRs
CTEEP also takes part in a sponsored program of Level 1 American Depositary Receipts (ADR), tied to ordinary and preferential shares at the rate of 1 Depositary Share for each share of both types.
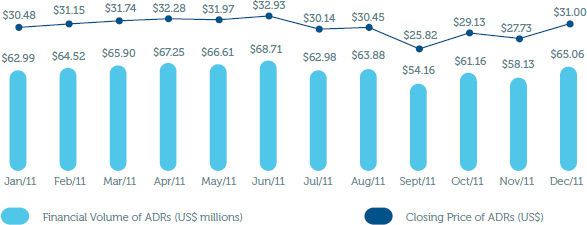
At the close of 2011, ADRs tied to preferential (more liquid) shares rose in value by 1.7% and the financial volume regarding these ADRs was 3.3% higher, totaling US$65.1 million.
