
About the Report


This is the 2008 Annual Report and Sustainability Report of CTEEP – Companhia de Transmissão de Energia Elétrica Paulista. It presents the economic, financial, social and environmental results of the company’s operations in Brazil for the period January 1 to December 31, 2008. GRI 3.1 e 3.6
In order to build a closer relationship with its stakeholders (employees, society, suppliers, shareholders and investors, clients and the State), this annual report presents the international guidelines of the Global Reporting Initiative (GRI) for application level C in for the first time. It also follows the recommendations of the new model for the preparation of annual socio-environmental responsibility reports for companies in the electricity sector, issued by the Brazilian Electricity Regulatory Agency (ANEEL). In April 2008, the company published its Annual Report for the first time, with results for the year 2007. GRI 3.2, 3.3 e 4.14
The operating and financial information, as well as comparisons with the 2007 fiscal year, are presented on the basis of consolidated figures and in Brazilian real, in accordance with Brazilian accounting standards and current corporations legislation, and have been audited by PriceWaterhouseCoopers Independent Auditors. Social and environmental data were verified and checked internally, without being submitted to an external audit. Data related to investments and Permitted Annual Revenue (PAR) refer only to CTEEP, and do not include the shares of partner companies in the new concessions acquired: IEMG (Interligação Elétrica de Minas Gerais), IENNE (Interligação Elétrica Norte e Nordeste), Pinheiros (Interligação Elétrica Pinheiros), IEMadeira (Interligação Elétrica do Madeira) and IESul (Interligação Elétrica Sul). GRI 3.7, 3.8, 3.9, 3.10, 3.11 e 3.13
The process of preparing and defining the content of this report was coordinated by the departments of Communication, Strategic Management and Finance and Investor Relations, with the involvement of employees from a range of areas and levels within the company. The final verification of the information involved the Chairman, Directors and Managers. One of the advances this year is the company’s effort to comply with the GRI guidelines (application level C), with a view to strengthening its relationship with all of its stakeholders. GRI 3.5
Additional information and clarification regarding this report or any part of its content can be obtained using the following communication channels. GRI 3.4
GRI Information:
site – www.cteep.com.br
e-mail – [email protected]
telephone – (+55 11) 3138-7205
Investor Relations Information:
e-mail – [email protected]
telephone – (+55 11) 3138-7557
CTEEP thanks you for your interest and wishes you good reading.
Main indicators
| Results (million R$) | 2004 | 2005 | 2006 | 2007 | 2008 |
|---|---|---|---|---|---|
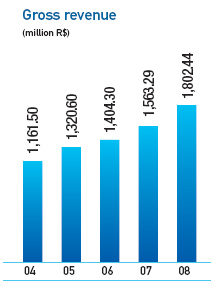
| Gross Revenue | 1,161.50 | 1,320.60 | 1,404.30 | 1,563.29 | 1,802.44 |
| Net Revenue | 1,097.90 | 1,205.20 | 1,323.00 | 1,315.41 | 1,564.07 |
| Gross Profit | 780.4 | 869.3 | 969.8 | 1,002.26 | 1,252.62 |
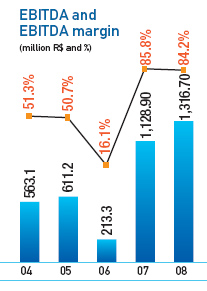
| EBITDA | 563.1 | 611.2 | 213.3 | 1,128.90 | 1,316.70 |
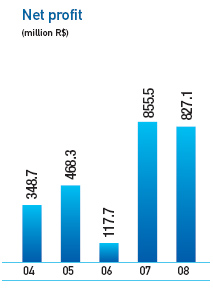
| Net Profit | 348.7 | 468.3 | 117.7 | 855.5 | 827.1 |
| Net Added Value | 1,016.60 | 1,159.40 | 1,213.10 | 1,408.10 | 1,504.20 |
| Margins (%) | |||||
| Gross Margin | 67.2% | 65.8% | 69.1% | 64.1% | 69.5% |
| EBITDA Margin | 51.3% | 50.7% | 16.1% | 85.8% | 84.2% |
| Net Margin | 31.8% | 38.9% | 8.9% | 65.0% | 52.9% |
| Financial Indicators (million R$) | |||||
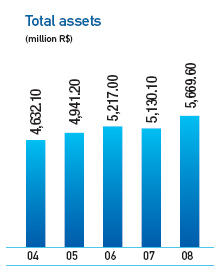
| Total Assets | 4,632.10 | 4,941.20 | 5,217.00 | 5,130.10 | 5,669.60 |
| Net Equity | 3,695.30 | 3,827.30 | 3,745.50 | 3,948.80 | 4,103.3 |
| Net Debt | -485.2 | -673.9 | -513.8 | 341.3 | 733.8 |
| Net Debt/EBITDA (ratio) | 0.9 | 1.1 | 2.4 | 0.3 | 0.7 |
| Market Indicators | |||||
| Number of shares traded (thousand) | 48,264 | 54,777 | 73,117 | 97,314 | 161,173 |
| Financial volume traded (thousand R$) | 489,742 | 1,050,447 | 1,322,899 | 2,177,821 | 3,164,810 |
| Closing quote (R$) | 14.6 | 26.4 | 30.62 | 38.7 | 42 |
| Net profit per share (R$/thousand shares) | 2.34 | 3.13 | 0.78 | 5.73 | 5.54 |
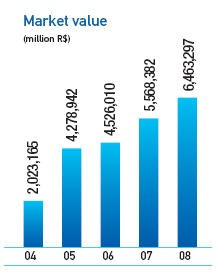
| Market value (thousand R$) | 2,023,165 | 4,278,942 | 4,526,010 | 5,568,382 | 6,463,297 |
| Sum paid out (Dividends and IOC) (thousand R$) | 75,000 | 421,654 | 114,952 | 822,495 | 734,900 |